Continued from Feeding the beast…
Our financial forecasting has proved to be a great tool to keep the Mihaly Slocombe beast satiated year-round. By starting with the money, we can prioritise projects and tasks to help us reach our earnings target each month. We can work out who’s going to work on what, how long it should take and when it needs to be finished.
At least, that’s the theory.
Mapping our monthly earnings against our forecasts back to August last year reveals two key insights. The first is positive: over time, our forecasting is (remarkably) constant, while our earnings are trending upwards. The second is less so: despite the general health of this financial picture, there’s enormous variation in both our forecasts and earnings from month to month. Generalised order, but localised chaos.

Each black dot represents a monthly forecast, ranging upwards from $0 along the bottom. The solid black line is the trend line.
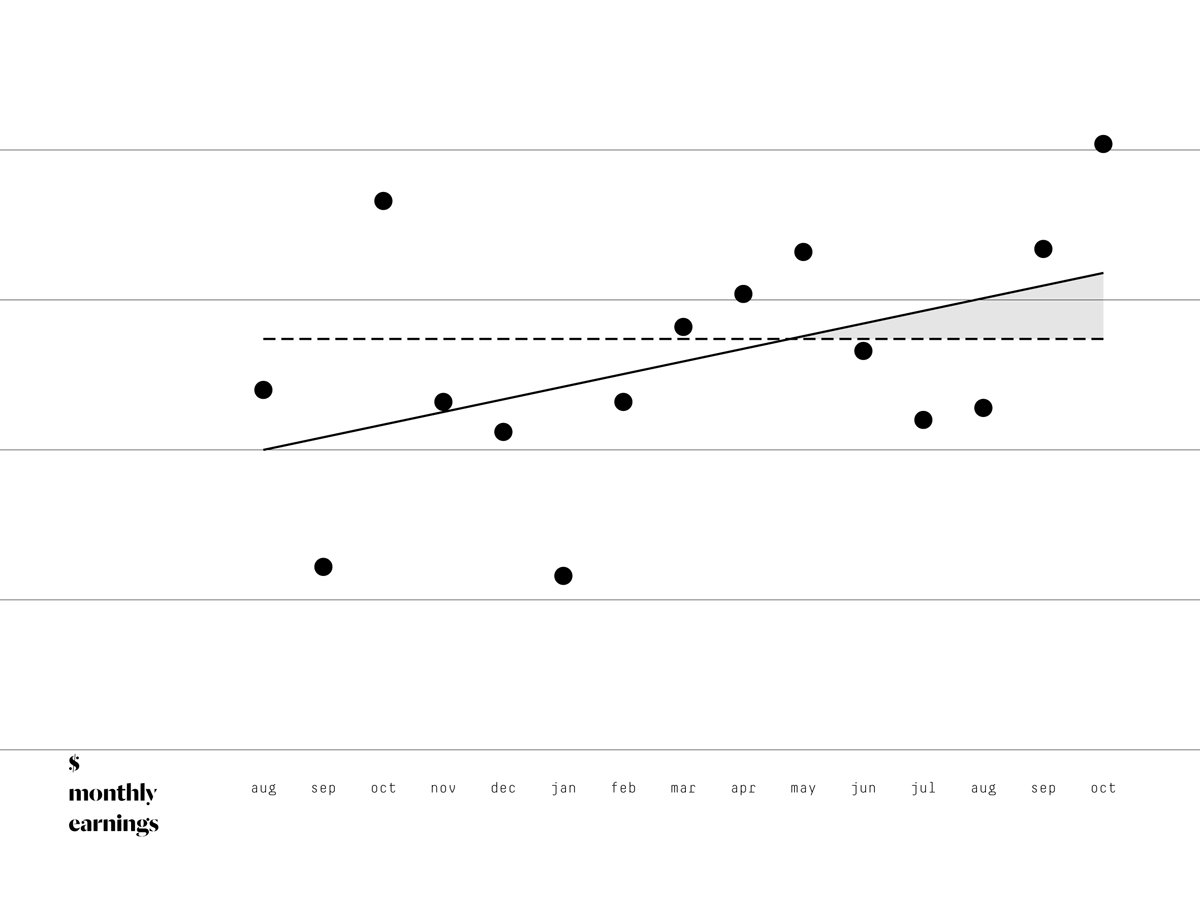
Here, each black dot represents our monthly earnings, again ranging upwards from $0 along the bottom. The dashed black line is the forecast trend line from the last graph, and the solid black line is the earnings trend line.
Why is our income so chaotic?
Achieving a predictable and consistent flow of income requires a consistent flow of project work getting done. Unfortunately (and here’s the hitch), this is easier said than done. There are a number of causes that lead to scarce billable work hours, but in my experience there are only two really significant ones:
- We spend too much time on a project. This stretches our fee thinly across more hours, as well as consumes time that could be spent on other (paying) projects.
- A project goes into hibernation.
I’ve discovered that the efficiency issue is one that naturally improves over time, mostly I think because people get better at the things they do repeatedly. As our studio has gotten older, we’ve become more confident in our detailing, more familiar with our documentation systems, and better able to access shortcuts from past projects. Over the life of the project, there are lots of little ways that we can be more productive. Enough small time savings add up.
The hibernation issue is unfortunately not one that naturally improves over time. When our projects pause, which they all eventually do, the beast gets hungry.
There are many, many reasons a project pauses: town planning periods drag on; clients take longer than expected to approve a design proposal; a consultant from whom we need drawings is busy on other projects; the tendering period draws out beyond its schedule. A hibernating project might kick off again after months or days, but either way the downtime needs to be managed.
When I used to work at other practices and this happened to one of my projects, it was never a problem. My boss would replace the hibernating project with other work and I’d get back to it. Simple, right? Well, the most important thing no-one told me when we started our architecture practice is that when we’re the boss, replacing the hibernating projects is our responsibility.
It turns out that doing this is really hard. Transitioning momentum away from one project onto another means slow periods on both as the first slows down and the other speeds up. Managing workflow means stopping what I’m doing so I can coordinate the new activities of others. And while it would be nice to maintain a long pipeline of work to fill these gaps, in practice this just pisses off the waiting clients. So client expectations need to be managed too.
While poor productivity is the main cause of income dilation (that is, when we charge a bit less on a project in a month than we forecast), hibernating projects are the main factor in introducing localised chaos to our financial management process. The evidence of this is revealed when I analyse the earnings at a micro level on any given project.
Digging back through our timesheets and invoicing, I tracked the evolving finances of one our projects currently under construction.
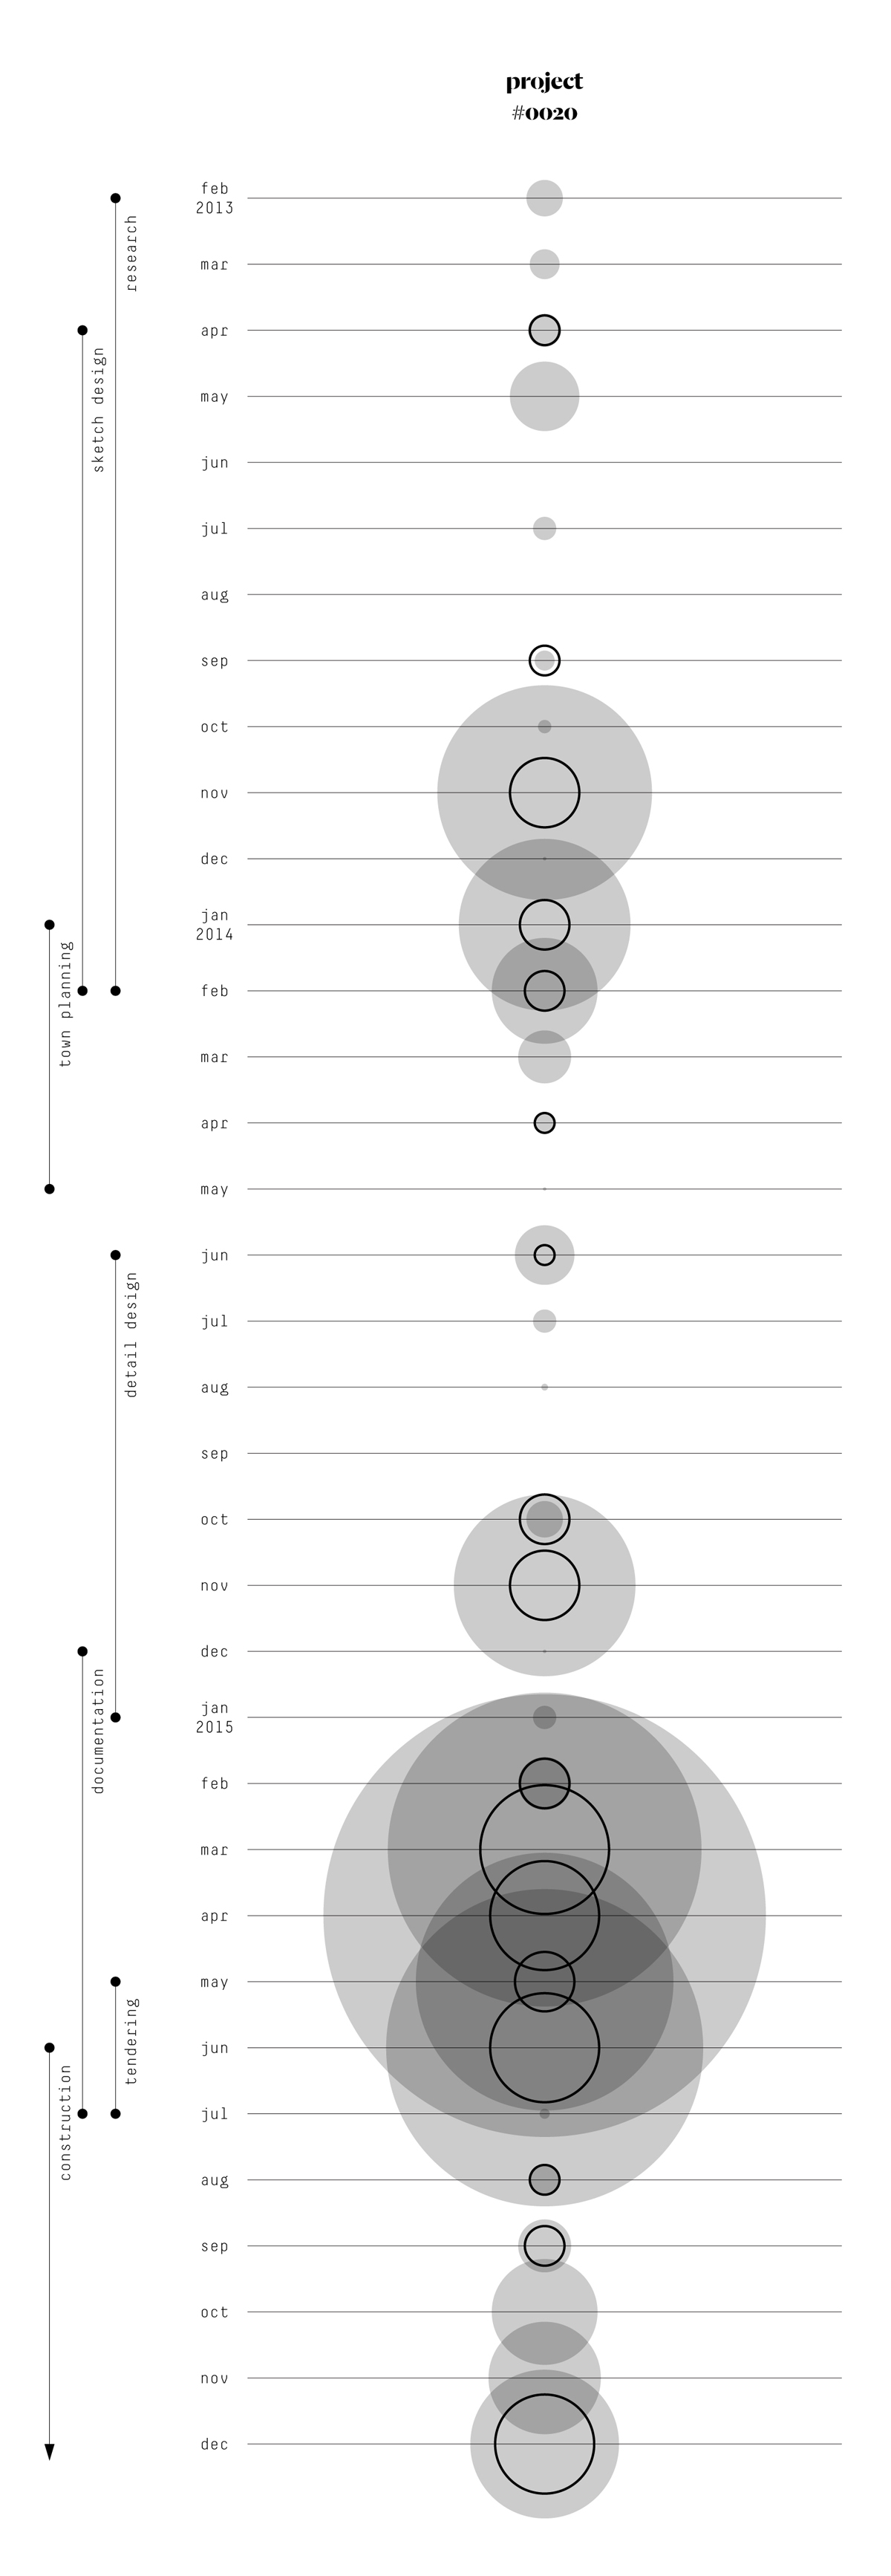
The black outline dots represent the fee invoiced in a month. The grey dots represent the number of hours worked in a month. The larger the dot, the larger the invoice / number of hours.
There are some fascinating insights here:
We began work very slowly on this project. It took us a good 8 months before we even started invoicing regularly.
The clustering of intense work periods is fairly typical for our workflow. We gather speed during each project stage, with an inevitable crescendo prior to delivery. You can see the big chunks of work at the ends of key project phases, with the biggest during documentation.
Also typical are the steadier hours during construction. You can see this in the second half of this year, once the project got on site.
Hours worked and invoicing are linked. Lots of hours are associated with more substantial invoicing. Likewise, fewer hours means sparser invoicing.
This project experienced two major periods of hibernation, from May – August 2013 and from March – September 2014. It is rare for us to experience such lengthy pauses and actually have the project restart. I’m pleased we’ve managed to proceed so far down the path with this one.
What can I learn?
Prior to taking on our current short-range forecasting approach, we did have a rudimentary form of time programming in place. The programming wasn’t linked to invoicing, and it was an annual exercise: two qualities that with the wisdom of hindsight I now see made it a tremendous waste of energy. In a consulting business like ours, time and money are two halves of the same coin. There’s no point looking at one without the other. And it’s simply impossible to know for certain what we’ll be working on a year from now.
Our forecasting now stretches only two months into the future, with the second month much sketchier than the first. Also, we never count on a project to continue predictably past any major milestone. The worst offenders are budget reviews: at these, we assume a project will die until told otherwise.
But despite our best efforts, at least once a year all of our projects go into hibernation simultaneously. This year, it happened in February and lasted a couple of weeks. By chance, we saw it coming, but even then it was tricky to stay busy. We used the time to sort out a backlog of administration work, and update our samples library. Previously, we’ve entered design competitions. Regardless, the things we find to fill our time are not project-related, so we have nothing to invoice.
Small or large, I reckon every architecture practice has to deal with this issue from time to time.
We try and minimise the trouble by keeping our forecasting tight, staggering our projects, and assuming we’ll have soft months. The tight forecasts improve our chances of being accurate with our predictions (though as the top two graphs show, this is far from a guarantee). The staggered projects reduce the likelihood that two projects will go into hibernation at the same time for the same reason. And by assuming we’ll have soft months, hopefully we can build up enough of a cash buffer to keep the beast fed.
Images
- Forecasts; author’s own image
- Earnings; author’s own image
- Project fees; author’s own image
Warwick, You have hit the nail on the head here.
I am just waking out a period of simultaneous pauses. Last half of the year last year I was trying to reduce the numbers of projects on the go at once. This I had done successfully, then the two main projects promptly went on hold in December, both yet to return. Fortunately 2 new project have come online in that time, but I am still recovering from this shock.
Thanks for the post, it is heartening it is somewhat comforting that it is not just me struggling to manage these issues. Interestingly I also have resorted to short range forecasting and project planning stage by stage.
Thanks for the comment, David. I reckon sole practitioners are the most vulnerable to this issue. With fewer projects and fewer staff, even one project going on hold can mean a big chunk of billable hours out the window. Hope you get through it okay!